The Analysis page draws charts of your water samples for a period and a set of measurement points, and lists them in a table.
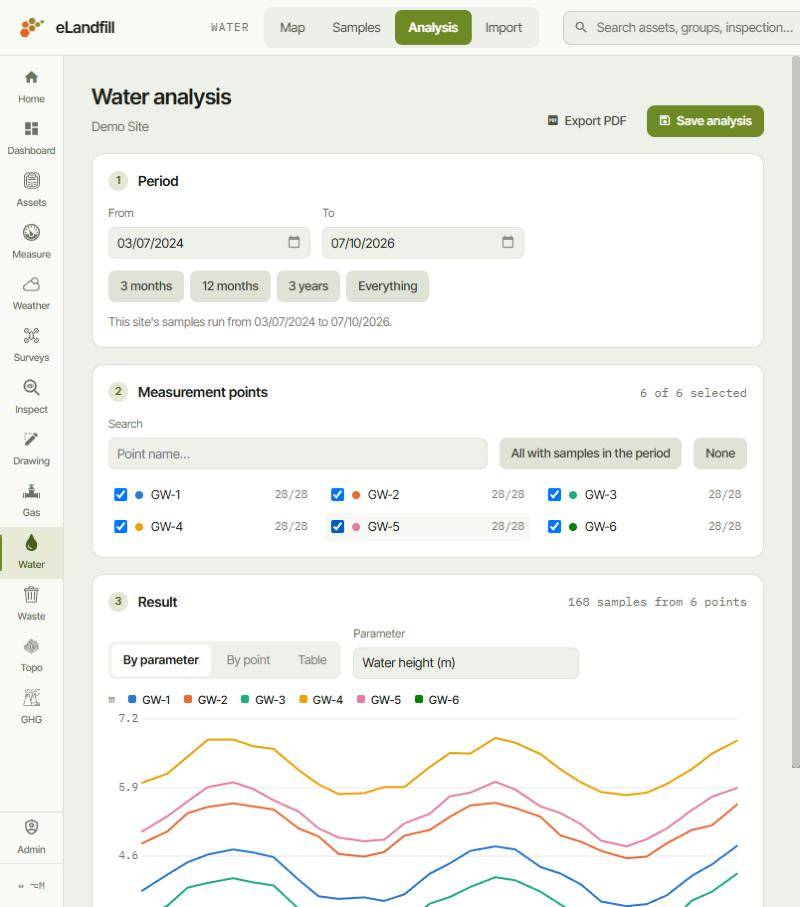
You work down the page in three numbered steps: Period, Measurement points, then Result.
¶ 1. Period
Set the dates with From and To, or click 3 months, 12 months, 3 years or Everything. Under the dates, the page tells you the first and last sample dates of the site.
¶ 2. Measurement points
Tick the points you want. Each point shows how many of its samples fall in the period, for example "28/28". The top right of the card shows how many points are selected.
- Search: find a point by name.
- All with samples in the period: tick every point that has a sample between your dates.
- None: untick them all.
Each point has its own colour, used in the charts.
¶ 3. Result
The header sums up the result, for example "168 samples from 6 points". The buttons on the left switch between three ways of displaying it.
¶ By parameter
One chart for one value, with one line per point, so you can compare the points on the same scale. Choose the value under Parameter, for example Water height (m). The lines use the points' colours from step 2.
¶ By point
One chart per parameter for a single point, so you can follow everything measured at that point. Choose the point under Point; each option shows how many samples it has.
- The number at the top right of each chart is the latest value.
- Values below the laboratory's detection limit are not plotted. A note under the chart says how many, for example "6 below detection, not plotted".
¶ Table
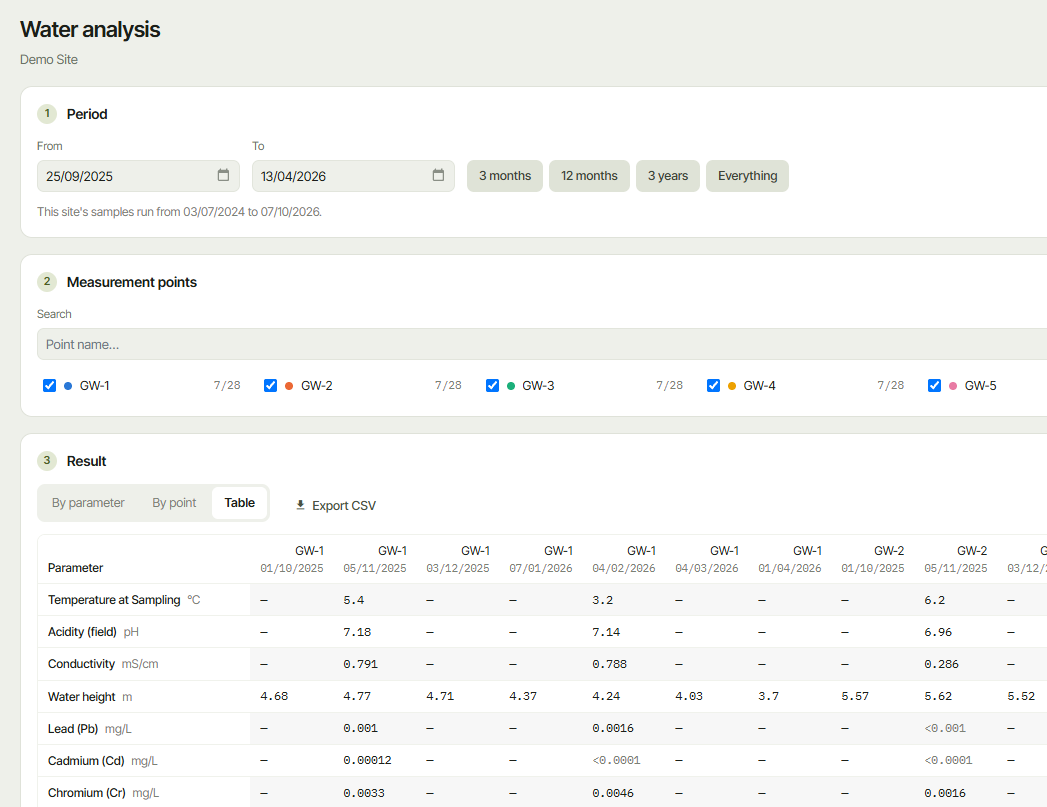
The values themselves, with one row per parameter and one column per sample. Each column header gives the point and the sampling date, and each row gives the parameter with its unit.
- — means the parameter was not measured in that sample.
- A value starting with <, for example <0.001, is below the laboratory's detection limit.
Click Export CSV, next to the view buttons, to download the table as a .csv file that you can open in Excel.
¶ Save or share the result
- Save analysis keeps the period and the points under a Name, with optional Notes, so you can come back to the same analysis.
- Export PDF saves the result as a PDF file.