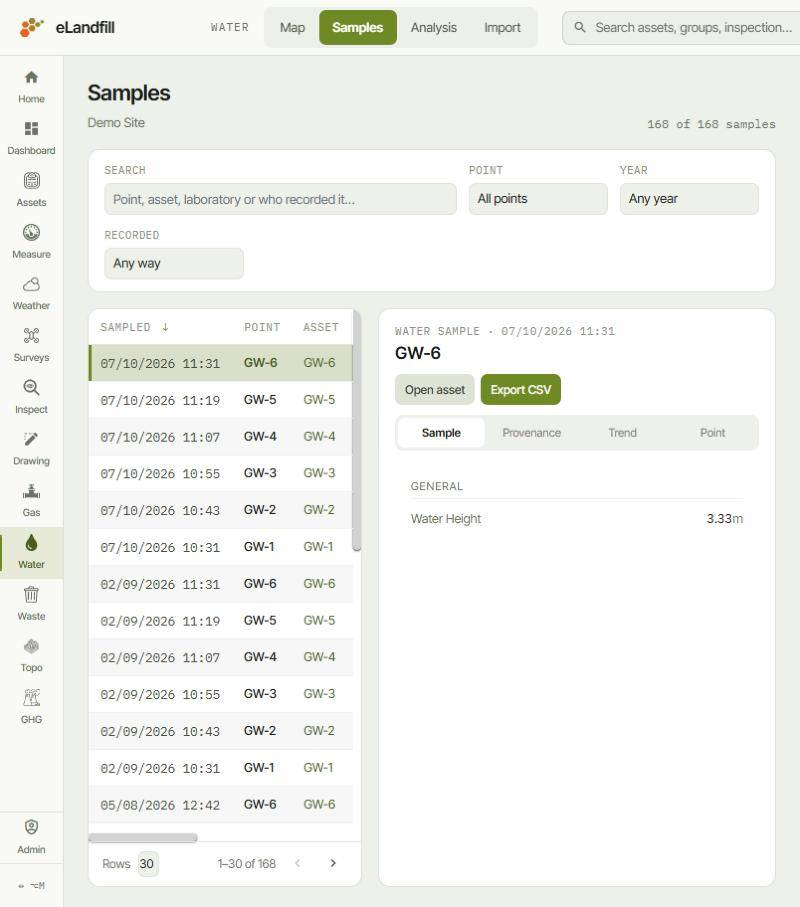
The Samples page lists every water sample of your site, newest first. Click a sample to see its values on the right.
¶ Find a sample
The number at the top right shows how many samples match, for example "168 of 168 samples". Narrow the list with:
- Search: type a point, an asset, a laboratory or who recorded the sample.
- Point: one measurement point, or All points.
- Year: one year, or Any year.
- Recorded: From a laboratory file, Typed on a phone, or Any way.
¶ The list
Each row is one sample:
- Sampled: the date and time of sampling. Click the header to sort.
- Point and Asset: where the sample was taken.
- Symbolic link.
- Values: how many values the sample holds. A field visit with only the water height shows 1; a full laboratory analysis shows many more.
- Laboratory and Recorded by.
Rows sets how many samples each page shows: 30, 50 or 100.
¶ One sample
The panel on the right shows the chosen sample:
- Sample: its values, grouped, for example General (water height, temperature, pH, conductivity), Elements (metals), Organic compounds and Inorganic compounds.
- Provenance: where it comes from, with its date of sampling.
- Trend: a chart of the point's values over time, with the Well profile for a well.
- Point: the measurement point and its asset.
Open asset opens the asset's page. Export CSV downloads the sample as a CSV file.