The Analysis page draws charts of your gas readings for a period and a set of measurement points. It also lists the readings in a table.
You work down the page in three numbered steps: Period, Measurement points, then Result.
¶ 1. Period
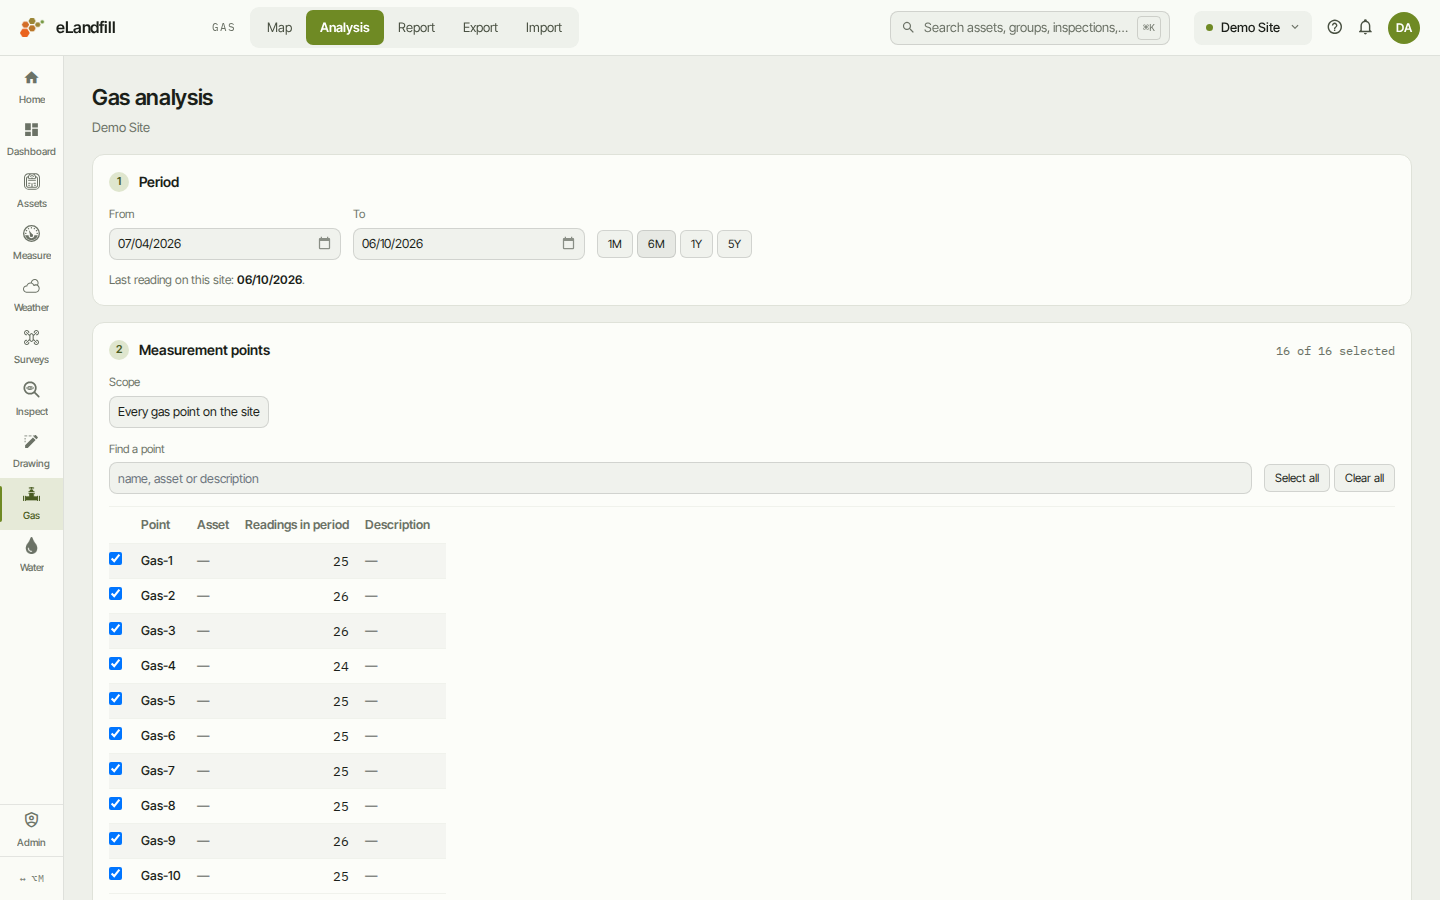
Set the dates with From and To, or click a quick range: 1M, 6M, 1Y or 5Y.
The page opens on the last month. Under the dates, the page tells you when the site last recorded a reading.
If that last reading is old, the quick ranges count back from it, not from today.
¶ 2. Measurement points
Choose which points to include with Scope:
- Every gas point on the site (the default).
- Points on assets in groups: then pick one or more groups under Groups.
- Points on chosen assets: then search for assets and add them. Click an asset's chip to remove it.
The table lists the points in that scope:
- Point: the measurement point's name.
- Asset: the asset it belongs to.
- Readings in period: how many readings the point has between your dates.
- Description.
Points with readings in the period are ticked to start with. A point with no readings in the period, such as a flare point, is greyed out and left unticked. The top right of the card shows how many are selected, for example "16 of 16 selected".
To narrow the list, type in Find a point. You can search by point name, asset or description.
Select all and Clear all act on every point, not just the page you see. While you search, they become Select matching and Clear matching.
A small map under the table shows where the selected points are.
The page keeps your choices while you work. The Export page uses the same period and points.
¶ 3. Result
Click Launch analysis. The result appears further down the same page.
Its header sums it up, for example "406 readings from 16 of 16 points", with the dates.
¶ By parameter
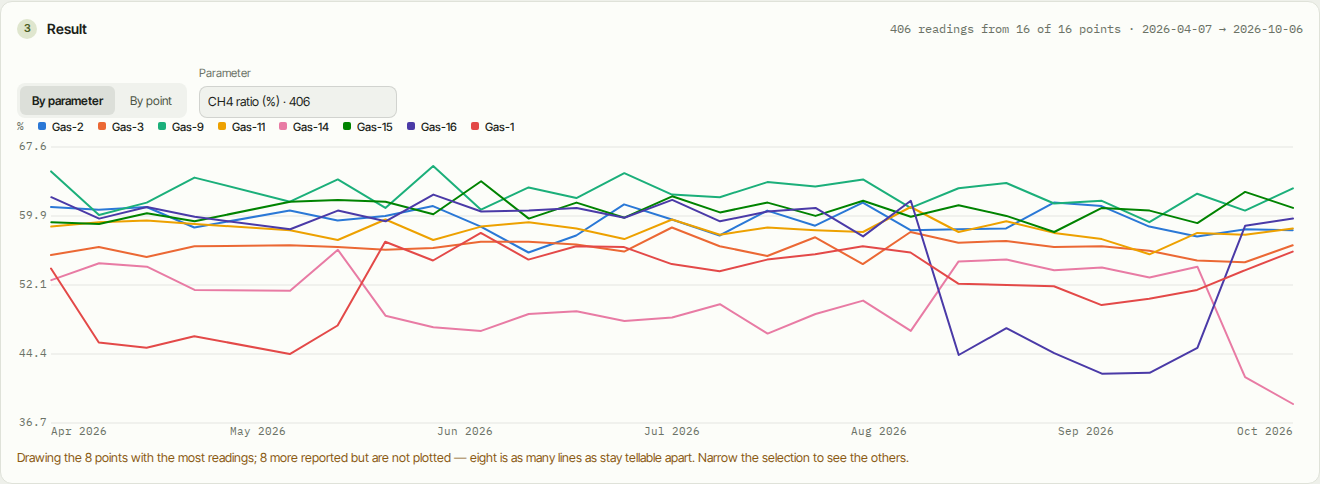
By parameter draws one line per point for one value, so you can compare points on the same scale.
Choose the value under Parameter. Each option shows how many readings carry it.
The chart draws at most 8 points: the ones with the most readings. A note under the chart says how many more were left out. To see them, select fewer points and launch the analysis again.
¶ By point
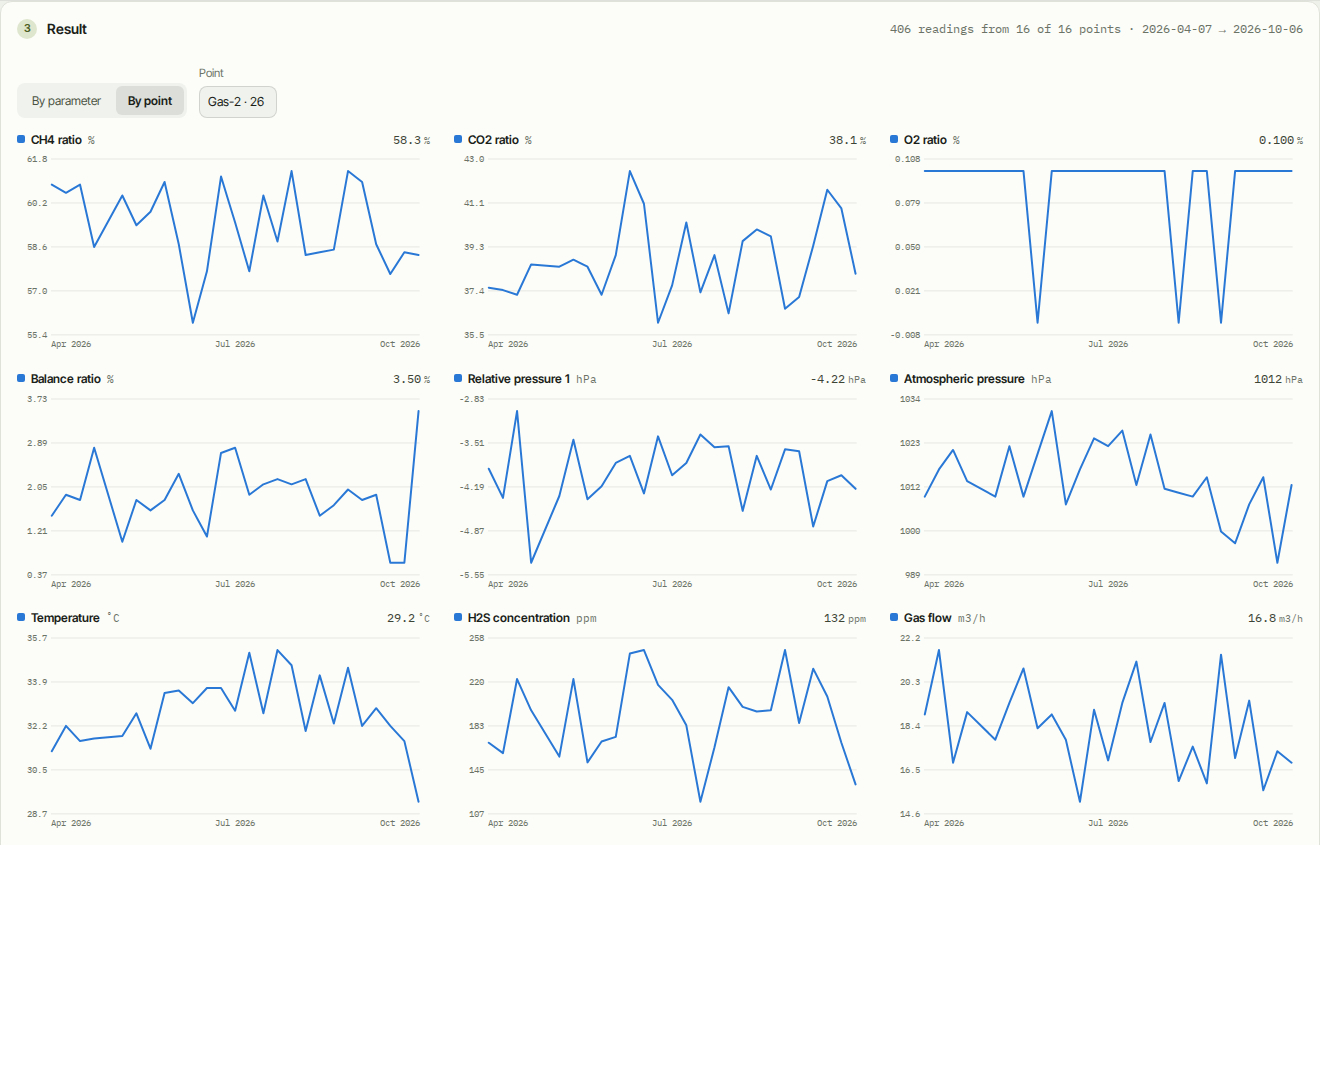
By point draws one chart per parameter for a single point. Choose the point under Point.
The number at the top right of each chart is the latest value.
¶ Readings
Under the charts, the Readings table lists the readings themselves, newest first. Click Show more to load more rows.
To download the readings, use the Export page. For a printable document, use the Report page.
¶ If something does not show
- "None of the selected points recorded anything between…": there are no readings in your period. The page also tells you the date of the most recent reading on the site. Move your period to include it.
- A point has 0 readings in the period: it was not measured between your dates. It will not appear in the charts.
- A point is missing from the list: check the Scope. A point only appears if its asset is in the scope you chose.
- Launch analysis does nothing: make sure at least one point is ticked.
For a single point's history, you can also click it on the Gas map.